The Statistics Module
The statistics service provides detailed data on the entire fleet performance. Automated fleet reporting enables to check on fleet performance at daily, weekly, monthly, and yearly data aggregation intervals in a selected period
The statistics service is used to improve fleet efficiency and it enables users to measure current fleet performance and track progress towards goals.
The Statistics
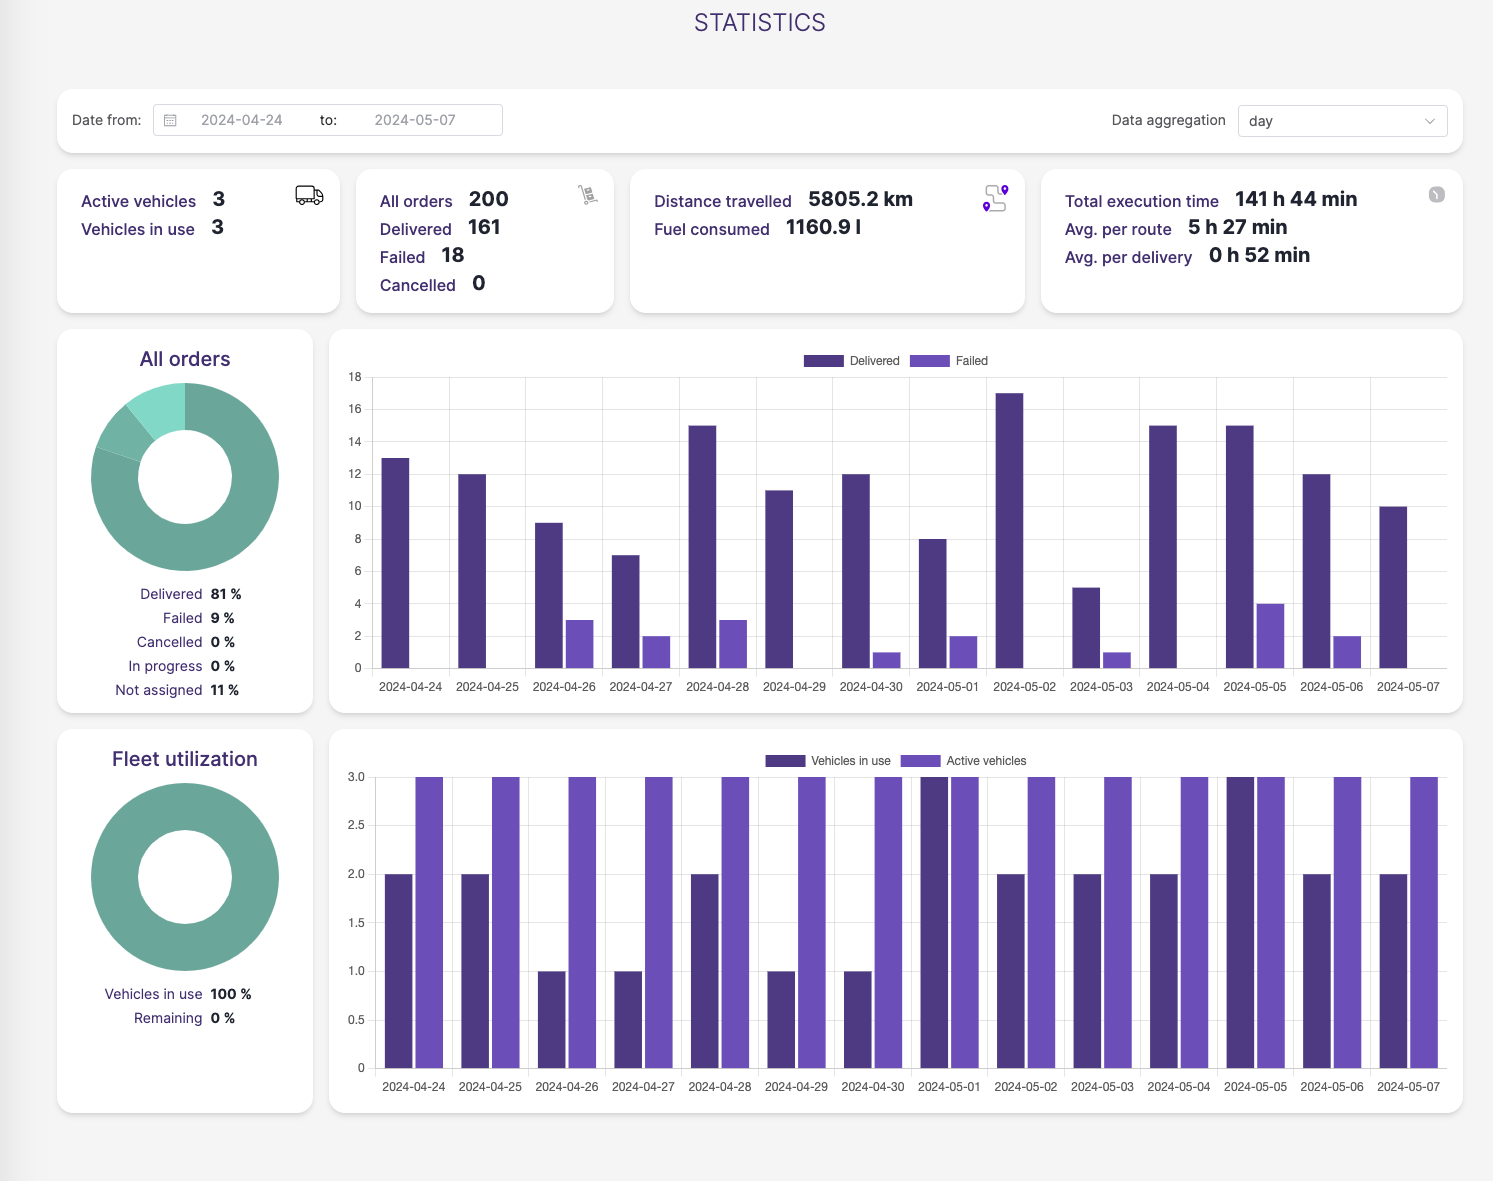
The Statistics tab provides general information about the fleet performance, like the number of unique vehicles, the number of executed orders, the total driven distance by fleet, and the total time of order execution.

The period and data aggregation interval selection
You can choose the period for which you want to analyze the fleet's performance by specifying the start and end date. Automatically, the system will display data for the last 7 days with daily time aggregation.
In the next step, you can adjust the temporal aggregation of data to your needs by selecting one of the options below.

The fleet performance
For the selected period and temporal aggregation of data, the statistics view (in the basic version) will display details about:
- active vehicles - i.e., vehicles that are ready to assigned to a route. We display the maximum number of daily counts of active vehicles for the selected period
- vehicles in use - the number of vehicles that were assigned to any route in assignments. Indicates the maximum number of daily counts of used vehicles for the selected period.
- all orders - the number of orders with a delivery date in the selected period.
- delivered orders - the number of orders delivered in the selected period.
- undelivered orders - the number of orders not delivered in the selected period.
- canceled orders - the number of orders canceled in the selected period.
- distance traveled [km] - the total distance traveled by all fleet vehicles in the given period (in km).
- fuel consumed - the total amount of fuel consumed by all vehicles in the given period [l].
- total execution time - a sum of execution time for all routes executed during the selected period. -
Route execution time- is the difference between the time of the first pickup and the time of the last dropp off on the route (the time the driver performs the action: "mark as picked up"/"mark as done"). Expressed in HH:MM. - average per route - calculated as the "total execution time" divided by the number of routes completed in the selected period. Expressed in HH:MM.
- average per delivery - total execution time divided by the number of orders delivered in the selected period. Expressed in HH:MM.
- fleet utilization [%] - calculated as the ratio of "working vehicles" to "active vehicles" expressed as a percentage.
- number of handled orders by status of their execution (the system allows you to customize the range of handled statuses to your needs).
The system allows you to adjust the scope of supported statuses to your needs